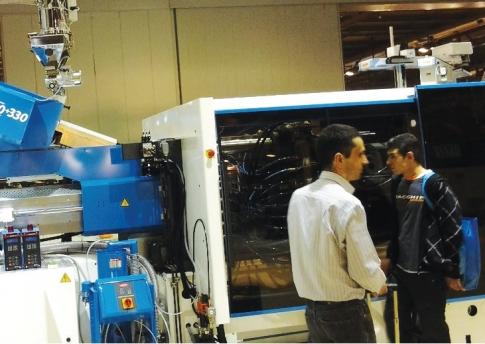
Plastic… the key innovation of many products and technologies in various sectors of economy such as pharmaceutical industry and healthcare, power generation, aerospace, automotive, marine, construction, electronics, packaging and textiles.
Plastics are more and more present in different sectors, the plastics industry having a share of 5.64% of total manufacturing.
In Romania, at the end of 2014, over 48 090 active companies were registrated in manufacturing, of which about 2 800 companies from the plastic and rubber sector, with an average number of 48 000 employees (according to statistics provided by the Romanian National Institute of Statistics).
Currently, around 2 500 manufacturing companies operate in the plastics processing field, distributed in the following areas:
- manufacture of plastic plates, sheets, tubes and profiles ~ 290 companies
- manufacture of packing goods ~ 370 companies
- manufacture of builders’ ware of plastics ~ 1350 companies
- manufacture of other plastic products ~ 490 companies

In the plastics industry, the highest share (74%) is in the segment of micro enterprises (0-9 employees), followed (with 19.3%) by the small enterprises (10- 49 employees).
The number of companies in the manufacture of plastic products recorded an increase between 2012-2014, the share being owned by companies with the status of micro- enterprises.
Large companies equipped with modern equipment were established in this sector by Romanian and foreign investors, particularly in the packaging, automotive and construction materials fields.
- Average number of employees between 2011-2014 (thousand persons)
| 2011 | 2012 | 2013 | 2014 | |
|
Manufacture of plastic
(222 NACE code)
|
35.9 | 37.2 | 38.1 | 40.3 |
- The main economic indicators for the plastic and rubber industry between 2011-2014

ASPAPLAST Note: *provisional data / ** January – November 2015 / ***unavailable data / Source: National Institute of Statistics; Portal of the Economy Ministry
- The Trade balance of Plastic Products (intraUE+Extra UE) between 2011-2015
| Plastic Products | 2011 | 2012 | 2013 | 2014 | 2015 | |
| EXPORT (FOB) | Ktons | 130.52 | 140.07 | 168.10 | 188.69 | 191.97 |
| IMPORT (CIF) | ktons | 417.59 | 412.79 | 428.38 | 453.22 | 532.40 |
|
The Trade
balance (FOB-CIF)
|
ktons | -287.07 | -272.72 | -260.28 | -264.53 | -340.44 |
- Production of plastic raw materials, manufactured between 2011-2015
| Product | 2011 | 2012 | 2013 | 2014 | 2015 | |
|
Production of plastic
raw materials (PE, PP,
PVC, PUR foams)
|
ktons | 188 | 143 | 145 | 163 | 154 |
Categories
- No categories
Archives
Useful links
Media galleries
Categories
- No categories


